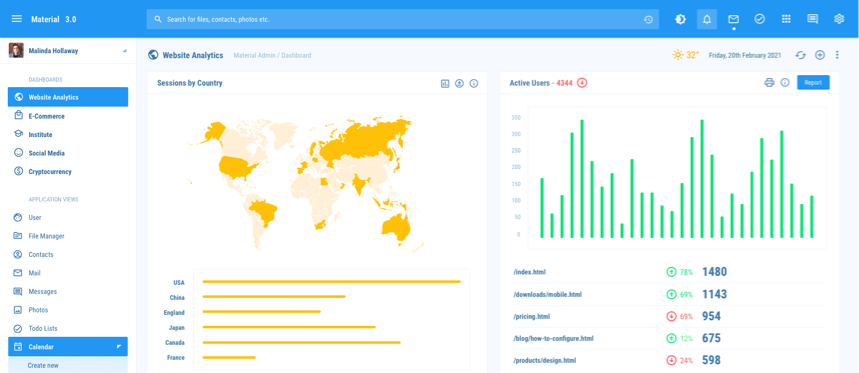
public Website Analytics
- Tailbreeze
- chevron_right
- Dashboards
Sessions by Country
Active Users
/index.html
arrow_circle_up 78%
1480
/downloads/mobile.html
arrow_circle_up 69%
1143
/pricing.html
arrow_circle_down 65%
954
/blog/how-to-configure.html
arrow_circle_up 12%
675
/products/design.html
arrow_circle_down 24%
580
Operating Systems Usage
Windows
Sessions
88643 (42.78%)
Linux
Sessions
29812 (32.7%)
MacOS
Sessions
23215 (22.6%)
Android
Sessions
12654 (11.4%)
iOS
Sessions
6583 (6.2%)
Others
Sessions
2375 (2.8%)
Device Sessions
laptop_mac
66%
9983
phone_iphone
46%
7532
devices
12%
3156
Desktop
Phone
Others
Visits by Source
645K
Total Sessions
Google
23981
52.6
arrow_circle_up
Direct
16342
31.3
arrow_circle_up
Bing
9736
10.5
arrow_circle_down
Others
7632
17.2
arrow_circle_down
Browser Bounce Rate
Google Chrome
22443
81%
arrow_circle_down
Apple Safari
18312
54%
arrow_circle_up
Mozilla Firefox
16234
43%
arrow_circle_up
Microsoft Edge
12956
32%
arrow_circle_down
Opera
10090
25%
arrow_circle_down
Internet Explorer
8354
18%
arrow_circle_down
Samsung Internet
7856
15%
arrow_circle_up
Engagements
4.970
Daily page views per visitor
2.5 trending_up
8.375
Daily time on site per about
3.2 trending_down
65.3%
Average bounce rate
0.1 trending_up
Average Visit Duration
Current Month
Last Month
Sessions by Channel
User Acquisition
Organic Search
45.1% arrow_circle_down
342.5K
Paid Search
68.6% arrow_circle_up
142.5K
Direct
34.6% arrow_circle_up
75.3K
Others
10.2% arrow_circle_up
35.7K